Using FusionCharts with ASP > Creating Drill-down charts
In our previous example, we had used FusionCharts to plot a chart using data stored in database. We'll now extend that example itself to create a drill-down chart which can show more information.
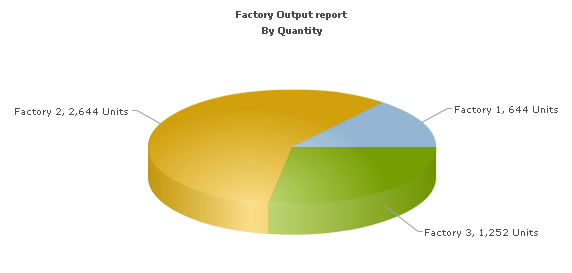
If you recall from previous example, we were showing the sum of factory output in a pie chart as under:
<%@ Language=VBScript %>
<HTML>
<HEAD>
<TITLE> FusionCharts - Database and Drill-Down Example </TITLE>
<SCRIPT LANGUAGE="Javascript" SRC="../../FusionCharts/FusionCharts.js"></SCRIPT>
</HEAD>
<!-- #INCLUDE FILE="../Includes/FusionCharts.asp" -->
<!-- #INCLUDE FILE="../Includes/DBConn.asp" -->
<BODY>
<%
'In this example, we show how to connect FusionCharts to a database.
'For the sake of ease, we've used an Access database which is present in
'../DB/FactoryDB.mdb. It just contains two tables, which are linked to each
'other.
'Database Objects - Initialization
Dim oRs, oRs2, strQuery
'strXML will be used to store the entire XML document generated
Dim strXML
'Create the recordset to retrieve data
Set oRs = Server.CreateObject("ADODB.Recordset")
'Generate the chart element
strXML = "<chart caption='Factory Output report' subCaption='By Quantity' pieSliceDepth='30' showBorder='1' formatNumberScale='0' numberSuffix=' Units' >"
'Iterate through each factory
strQuery = "select * from Factory_Master"
Set oRs = oConn.Execute(strQuery)
While Not oRs.Eof
'Now create second recordset to get details for this factory
Set oRs2 = Server.CreateObject("ADODB.Recordset")
strQuery = "select sum(Quantity) as TotOutput from Factory_Output where FactoryId=" & ors("FactoryId")
Set oRs2 = oConn.Execute(strQuery)
'Generate <set label='..' value='..' link='..' />
'Note that we're setting link as Detailed.asp?FactoryId=<<FactoryId>> and then URL Encoding it
strXML = strXML & "<set label='" & ors("FactoryName") & "' value='" & ors2("TotOutput") & "' link='" & Server.URLEncode("Detailed.asp?FactoryId=" & ors("FactoryId")) & "'/>"
'Close recordset
Set oRs2 = Nothing
oRs.MoveNext
Wend
'Finally, close <chart> element
strXML = strXML & "</chart>"
Set oRs = nothing
'Create the chart - Pie 3D Chart with data from strXML
Call renderChart("../../FusionCharts/Pie3D.swf", "", strXML, "FactorySum", 600, 300, false, false)
%>
</BODY>
</HTML>
As you can see in the code above, we're doing the following:
- Include FusionCharts.js JavaScript class and FusionCharts.asp , to enable easy embedding of FusionCharts.
- We then include DBConn.asp, which contains connection parameters to connect to Access database.
- Thereafter, we generate the XML data document by iterating through the recordset. We store the XML data in strXML variable. To each <set> element, we add the link attribute, which points to Detailed.asp - the page that contains the chart to show details. We pass the factory id of the respective factory by appending it to the link. We finally URL Encode the link, which is a very important step.
- Finally, we render the chart using renderChart() method and pass strXML as dataXML.
Let's now shift our attention to Detailed.asp page.
<%@ Language=VBScript %>
<HTML>
<HEAD>
<TITLE> FusionCharts - Database and Drill-Down Example </TITLE>
<SCRIPT LANGUAGE="Javascript" SRC="../../FusionCharts/FusionCharts.js"></SCRIPT>
</HEAD>
<!-- #INCLUDE FILE="../Includes/FusionCharts.asp" -->
<!-- #INCLUDE FILE="../Includes/DBConn.asp" -->
<BODY>
<%
'This page is invoked from Default.asp. When the user clicks on a pie
'slice in Default.asp, the factory Id is passed to this page. We need
'to get that factory id, get information from database and then show
'a detailed chart.
'First, get the factory Id
Dim FactoryId
'Request the factory Id from Querystring
FactoryId = Request.QueryString("FactoryId")
Dim oRs, strQuery
'strXML will be used to store the entire XML document generated
Dim strXML, intCounter
intCounter = 0
Set oRs = Server.CreateObject("ADODB.Recordset")
'Generate the chart element string
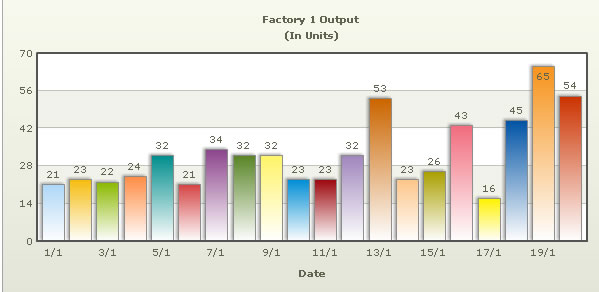
strXML = "<chart palette='2' caption='Factory " & FactoryId &" Output ' subcaption='(In Units)' xAxisName='Date' showValues='1' labelStep='2' >"
'Now, we get the data for that factory
strQuery = "select * from Factory_Output where FactoryId=" & FactoryId
Set oRs = oConn.Execute(strQuery)
While Not oRs.Eof
'Here, we convert date into a more readable form for set label.
strXML = strXML & "<set label='" & datePart("d",ors("DatePro")) & "/" & datePart("m",ors("DatePro")) & "' value='" & ors("Quantity") & "'/>"
Set oRs2 = Nothing
oRs.MoveNext
Wend
'Close <chart> element
strXML = strXML & "</chart>"
Set oRs = nothing
'Create the chart - Column 2D Chart with data from strXML
Call renderChart("../../FusionCharts/Column2D.swf", "", strXML, "FactoryDetailed", 600, 300, false, false)
%>
</CENTER>
</BODY>
</HTML>
In this page, we're:
- Including FusionCharts.js JavaScript class and FusionCharts.asp , to enable easy embedding of FusionCharts.
- Requesting the factory id for which we've to show detailed data. This data was sent to us as querystring, as a part of pie chart link.
- We get the requisite data for this factory from database and then convert it into XML using string concatenation.
- Finally, we render a Column 2D chart using renderChart() method to show detailed data.
When you now run the app, you'll see the detailed page as under: